American cement plants made about 82 million metric tons of cement last year, and the country still had to import a fifth of what it used. Ready-mix prices are 40% higher than they were at the start of 2020. Three of every four contractors with openings for concrete workers report trouble filling them.
Those numbers come from the U.S. Geological Survey, the Bureau of Labor Statistics and the Associated General Contractors of America. This page collects 118 of them, each linked to the agency or research group that produced it and dated to its release.
We pour concrete in Lawrence, Kansas, so the page goes deepest on Kansas: how many times a year the ground here freezes and thaws, how long state highway concrete has lasted, and what is getting built in Douglas County.
Key Takeaways
- U.S. plants produced an estimated 82 million metric tons of portland and blended cement in 2025, at 97 plants in 34 states and Puerto Rico (USGS Mineral Commodity Summaries, Feb 2026).
- Ready-mix concrete producers buy 70% to 75% of all cement sold in the United States (USGS Mineral Commodity Summaries, Feb 2026).
- The producer price index for ready-mix concrete stood 40.4% higher in October 2026 than in January 2020 (BLS Producer Price Index via FRED, Oct 2026).
- 60.5% of single-family homes started in 2025 came with a patio (NAHB Eye on Housing, Sep 2026).
- 73% of new single-family homes started in 2025 sit on a slab foundation (NAHB Eye on Housing, Oct 2026).
- Foundations account for 10.5% of the cost of building a typical new home (NAHB Cost of Construction Survey, Jan 2025).
- Kansas pavement goes through about 78 freeze-thaw cycles a year, 33 of them hard freezes below 23°F (Kansas Department of Transportation, Sep 2014).
- State inspectors found D-cracking on 41% of Kansas concrete highway projects they surveyed, 54 of 131 (Kansas Department of Transportation, Sep 2014).
- Lawrence, Kansas averages 103.5 days a year with a low at or below 32°F (NOAA Climate Normals, May 2021).
- 76% of contractors with openings for concrete workers report trouble filling them (AGC Workforce Survey Analysis, Sep 2026).
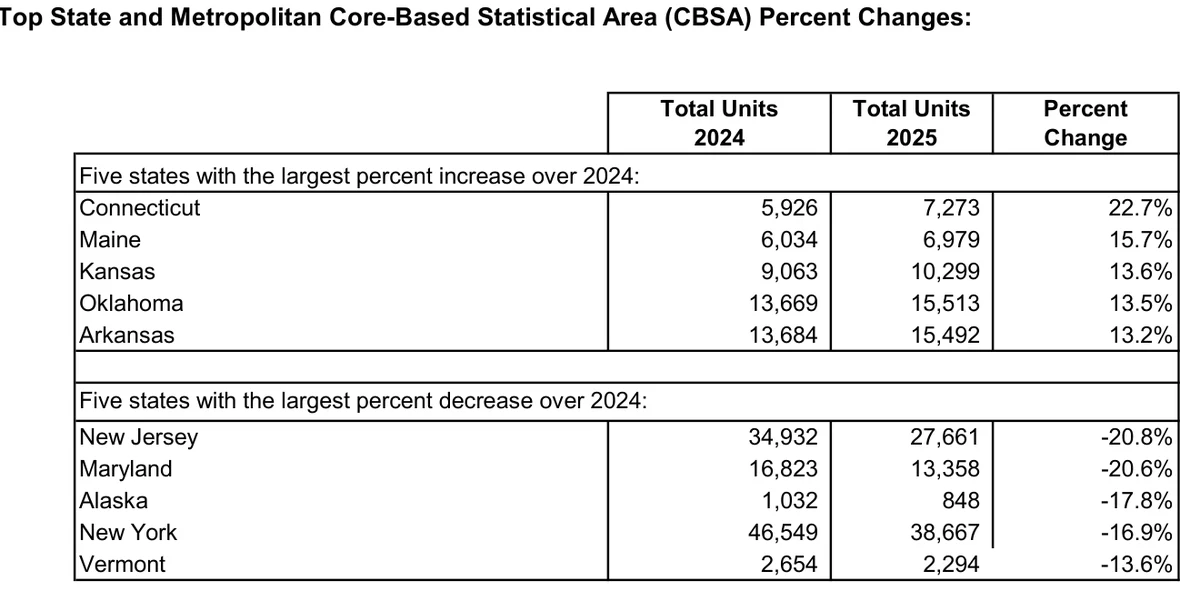
- Kansas permitted 10,299 housing units in 2025, up 13.6% and the third-largest percentage gain of any state (U.S. Census Bureau Building Permits Survey, May 2026).
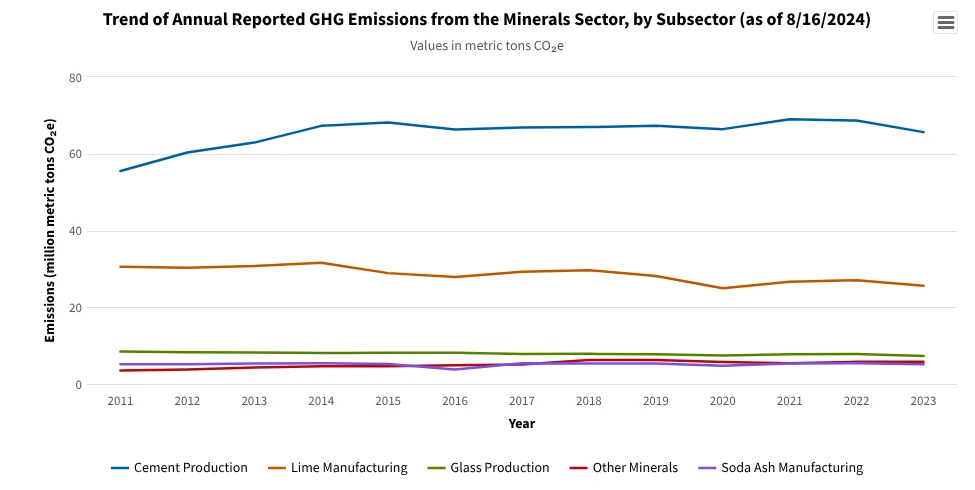
- U.S. cement plants reported 65.6 million metric tons of CO2-equivalent emissions for 2023, from 91 facilities (EPA Greenhouse Gas Reporting Program, Aug 2024).
- 1,032 construction and extraction workers died from on-the-job injuries in 2024 (BLS Census of Fatal Occupational Injuries, Feb 2026).
How much cement and concrete does the US make and use?
Cement is a regional business with a national supply gap. Domestic kilns have been running below what the country uses for years, and the difference comes in by ship.
How much cement does the US produce?
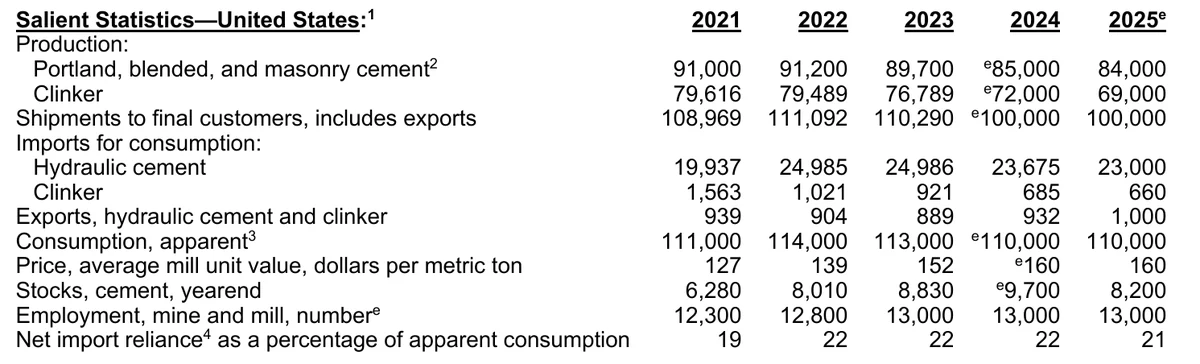
About 84 million metric tons a year once masonry cement is counted, from fewer than 100 plants.
- Texas, Missouri, California and Florida together produce about 44% of U.S. cement (USGS Mineral Commodity Summaries, Feb 2026).
- Cement shipments in 2025 came to an estimated 100 million metric tons, worth $17 billion (USGS Mineral Commodity Summaries, Feb 2026).
- Full-year shipments of portland and blended cement totaled an estimated 101 million metric tons in 2025, down 1.7% from 2024 (USGS Mineral Industry Surveys, Apr 2026).
- Clinker production fell 4.4% in 2025, to an estimated 69.5 million metric tons (USGS Mineral Industry Surveys, Apr 2026).
- U.S. clinker capacity is about 100 million metric tons a year (USGS Mineral Commodity Summaries, Feb 2026).
- Cement mines and mills employ roughly 13,000 people (USGS Mineral Commodity Summaries, Feb 2026).
Who buys cement?
Mostly ready-mix plants. The rest goes to companies that cast block, pipe and precast, and to contractors who buy direct.
- Concrete product manufacturers take 11% of cement sales, and contractors take 8% to 10% (USGS Mineral Commodity Summaries, Feb 2026).
- Texas, Florida and California use the most cement, in that order (USGS Mineral Commodity Summaries, Feb 2026).
- In December 2025 the five largest consuming states received 47.3% of all shipments (USGS Mineral Industry Surveys, Apr 2026).
- Masonry cement production dropped 2.7% in 2025, to an estimated 2.1 million metric tons (USGS Mineral Commodity Summaries, Feb 2026).
How much cement does the US import?
About a fifth of what it uses.
- Net imports covered 21% of apparent U.S. cement consumption in 2025 (USGS Mineral Commodity Summaries, Feb 2026).
- Apparent consumption was an estimated 110 million metric tons, unchanged from 2024 (USGS Mineral Commodity Summaries, Feb 2026).
- Turkey supplied 32% of imported cement and clinker from 2021 through 2024, ahead of Canada at 20%, Vietnam at 13% and Greece at 9% (USGS Mineral Commodity Summaries, Feb 2026).
- Imports of cement and clinker reached 25.4 million metric tons in 2025, up 1.5% (USGS Mineral Industry Surveys, Apr 2026).
How much sand, gravel and stone goes into concrete?
Cement is the glue. By weight, most of a concrete slab is aggregate.
- Producers sold an estimated 870 million metric tons of construction sand and gravel in 2025, valued at $12.6 billion (USGS Mineral Commodity Summaries, Feb 2026).
- 42% of that sand and gravel went into portland cement concrete as aggregate (USGS Mineral Commodity Summaries, Feb 2026).
- About 3,400 companies run 6,500 sand and gravel pits across all 50 states (USGS Mineral Commodity Summaries, Feb 2026).
- Crushed stone output was an estimated 1.5 billion metric tons, valued at $27 billion (USGS Mineral Commodity Summaries, Feb 2026).
- 17% of crushed stone was used to manufacture cement (USGS Mineral Commodity Summaries, Feb 2026).
- Limestone and dolomite make up about 70% of crushed stone production (USGS Mineral Commodity Summaries, Feb 2026).
- Old asphalt and concrete road surfaces were recycled in all 50 states in 2025 (USGS Mineral Commodity Summaries, Feb 2026).
How does US cement output compare with the rest of the world?
It is small. China makes about twenty times as much.
- World cement production was an estimated 3.8 billion metric tons in 2025 (USGS Mineral Commodity Summaries, Feb 2026).
- China produced an estimated 1.7 billion metric tons (USGS Mineral Commodity Summaries, Feb 2026).
- India produced an estimated 470 million metric tons, and Vietnam about 100 million (USGS Mineral Commodity Summaries, Feb 2026).
What does concrete cost in 2026?
Concrete got expensive in 2021 and 2022 and never came back down. Prices have mostly flattened since, which is as much relief as buyers have had.
How fast are ready-mix concrete prices rising?
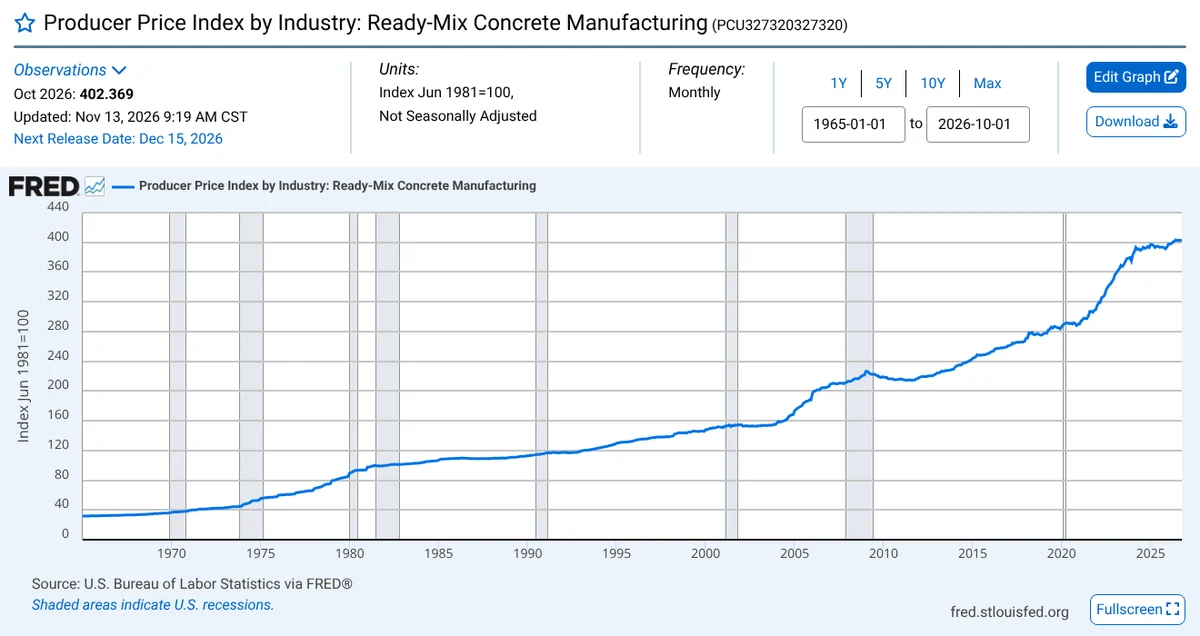
More slowly than they were, but still rising.
- The ready-mix producer price index read 402.4 in October 2026, up 2.4% from a year earlier (BLS Producer Price Index via FRED, Oct 2026).
- Midwest ready-mix prices rose 3.2% over the same 12 months (BLS Producer Price Index via FRED, Oct 2026).
- Since January 2020, Midwest ready-mix prices are up 45.2% (BLS Producer Price Index via FRED, Oct 2026).
What is happening to cement, block and aggregate prices?
Cement has stopped climbing. Block and precast have not.
- Cement manufacturing prices slipped 0.4% in the year to October 2026 (BLS Producer Price Index via FRED, Oct 2026).
- The average mill value of cement was $160 a metric ton in 2025, against $127 in 2021 (USGS Mineral Commodity Summaries, Feb 2026).
- Concrete block and brick prices are 54.6% above their January 2020 level (BLS Producer Price Index via FRED, Oct 2026).
- Prices for other concrete products, a category that includes precast, rose 9.1% in the year to October 2026 (BLS Producer Price Index via FRED, Oct 2026).
- Construction sand and gravel averaged $14.50 a metric ton in 2025, up from $10.52 in 2021 (USGS Mineral Commodity Summaries, Feb 2026).
- Crushed stone averaged $18.50 a metric ton, up from $13.26 in 2021 (USGS Mineral Commodity Summaries, Feb 2026).
How much construction spending is behind the demand?
A little over $2 trillion a year, and it has been shrinking.
- Construction spending ran at a seasonally adjusted annual rate of $2,186.1 billion in September 2026, 2.7% below September 2025 (U.S. Census Bureau Construction Spending, Nov 2026).
- Private residential construction ran at an annual rate of $848.8 billion (U.S. Census Bureau Construction Spending, Nov 2026).
- Public highway construction ran at an annual rate of $149.2 billion (U.S. Census Bureau Construction Spending, Nov 2026).
- Spending over the first nine months of 2026 was 2.9% lower than in the same months of 2025 (U.S. Census Bureau Construction Spending, Nov 2026).
How much concrete goes into a new home?
Most of the concrete in a new house is the part nobody photographs: the slab, the basement walls, the garage floor. The patio is the one piece the homeowner picks.
How many new homes are built with a patio?
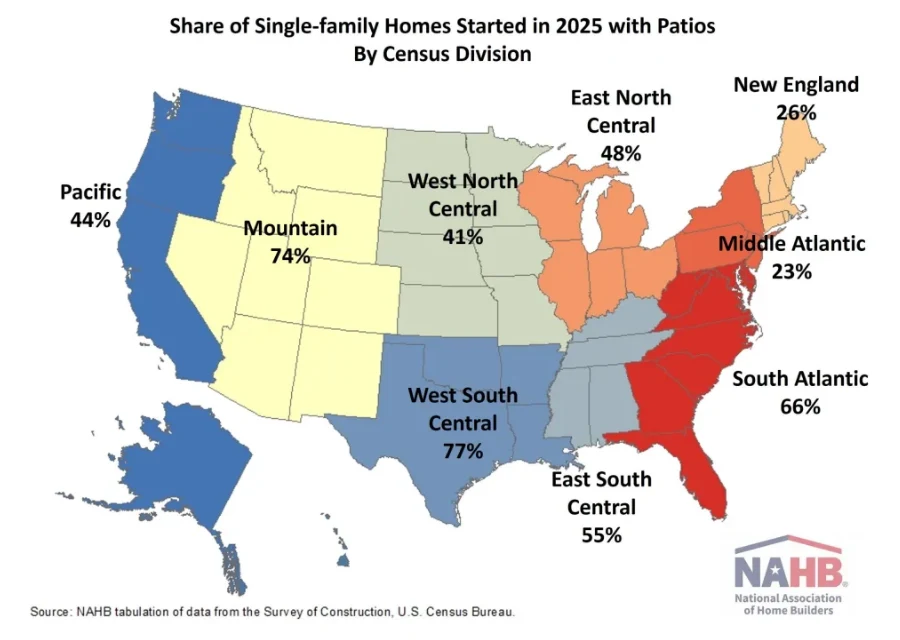
Six in ten, though the share has slipped two years running.
- The patio share fell from 61.8% in 2024 and is the lowest since 2019, when it was 59.6% (NAHB Eye on Housing, Sep 2026).
- Patios are most common in the West South Central division at 77% and the Mountain division at 74% (NAHB Eye on Housing, Sep 2026).
- In the West North Central division, which includes Kansas, 41% of new homes have a patio (NAHB Eye on Housing, Sep 2026).
- The average new-home patio is about 320 square feet nationally and a little over 200 in the West North Central division (NAHB Eye on Housing, Sep 2026).
If you are adding one to an existing house, our concrete patio page covers sizes and finishes.
What kind of foundation do builders pour?
A slab, almost everywhere except the Northeast and the northern Plains, where basements still win.
- Full or partial basements went under 16.4% of homes started in 2025, and crawl spaces under 9.7% (NAHB Eye on Housing, Oct 2026).
- In the West North Central division, 64.4% of new homes have a basement (NAHB Eye on Housing, Oct 2026).
- In the West South Central division, 97.7% of new homes are on slabs (NAHB Eye on Housing, Oct 2026).
- Finished basement space averages 957 square feet in the West North Central division, against 1,143 nationally (NAHB Eye on Housing, Oct 2026).
How common are decks, porches and garages?
Porches are on two of three new homes and garages on about nine of ten. Decks have lost ground to patios.
- 17.8% of homes started in 2025 have a deck, up from a record low of 17.4% in 2024 (NAHB Eye on Housing, Oct 2026).
- Decks are on 43% of new homes in the West North Central division (NAHB Eye on Housing, Oct 2026).
- 67.2% of homes started in 2024 have a porch (NAHB Eye on Housing, Oct 2025).
- Front porches on new homes average about 100 square feet (NAHB Eye on Housing, Oct 2025).
- 65% of single-family homes completed in 2024 have a two-car garage, and 15% have room for three or more cars (NAHB Eye on Housing, Sep 2025).
- In the West North Central division, 33% of new homes have a garage for three or more cars (NAHB Eye on Housing, Sep 2025).
How many homes are being built?
Starts are running a little over 1.2 million units a year, counting apartments.
- Housing starts ran at a seasonally adjusted annual rate of 1,221,000 in September 2026 (U.S. Census Bureau New Residential Construction, Oct 2026).
- Single-family permits ran at an annual rate of 845,000 in September 2026, down 4.0% from August (U.S. Census Bureau New Residential Construction, Oct 2026).
- Construction costs made up 64.4% of the average new-home sales price in 2024, the highest share since the survey began in 1998 (NAHB Cost of Construction Survey, Jan 2025).
Why does concrete wear out faster in Kansas?
Kansas is hard on concrete because the temperature here crosses the freezing mark so often. Water soaks into the slab, freezes, thaws and does it again the next night, dozens of times each winter.
How many times a year does concrete freeze and thaw in Lawrence?
On most freezing days. The daytime high usually climbs back above 32°F.
- The high temperature in Lawrence stays at or below freezing on only 23.6 days in an average year (NOAA Climate Normals, May 2021).
- Kansas highway engineers test concrete aggregate through 660 freeze-thaw cycles, up from 300, to represent 33 hard freezes a year over a 20-year design life (Kansas Department of Transportation, Sep 2014).
How long does concrete pavement last in Kansas?
Not as long as the state planned for.
- Kansas specifications from the 1980s expected 95% of concrete pavements to go 20 years before D-cracking, and a 2010 to 2012 field survey found the real figure was 11 years (Kansas Department of Transportation, Sep 2014).
- Projects that failed showed D-cracking between 9 and 19 years after construction (Kansas Department of Transportation, Sep 2014).
- The survey covered 133 projects, about 73% of the state's concrete highway system (Kansas Department of Transportation, Sep 2014).
- The aggregate in those pavements came from 52 quarries (Kansas Department of Transportation, Sep 2014).
- D-cracking has been damaging Kansas concrete pavement since the 1930s (Kansas Department of Transportation, Sep 2014).
What weather does a Lawrence driveway or patio have to handle?
Wet springs, hot summers and a winter that hovers around freezing.
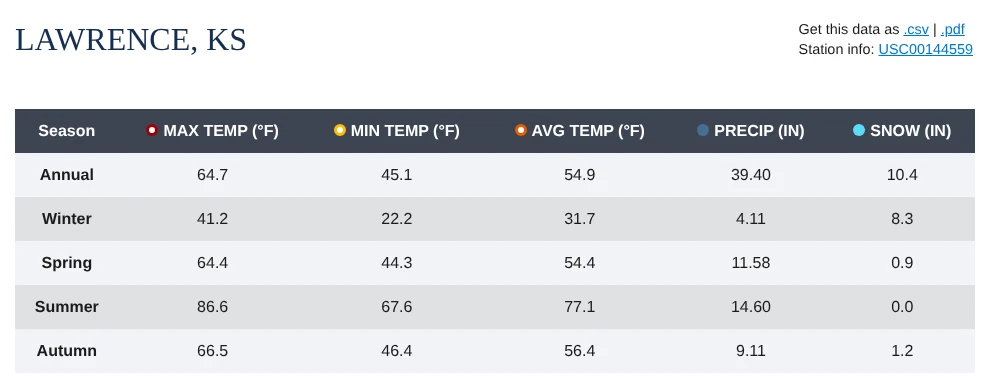
- Lawrence averages 39.40 inches of precipitation a year (NOAA Climate Normals Quick Access, May 2021).
- Snowfall averages 10.4 inches a year (NOAA Climate Normals Quick Access, May 2021).
- The average winter low is 22.2°F (NOAA Climate Normals Quick Access, May 2021).
- The temperature reaches 90°F or higher on 42.2 days in an average year (NOAA Climate Normals, May 2021).
Freeze-thaw damage usually shows up first as surface scaling and cracks along the joints. Our pages on concrete repair and concrete leveling explain when a slab can be saved. For an estimate in Lawrence or Douglas County, call 785-465-5639.
Who pours the concrete, and are there enough of them?
There are not. Contractors have cut headcount in a soft market and still can't fill the concrete jobs they have open.
How hard is it to hire concrete workers?
Harder than a year ago for half the firms that are trying.
- 87% of construction firms have openings for hourly trade workers (AGC 2026 Workforce Survey, Sep 2026).
- Among those firms, 88% say the jobs are as hard or harder to fill than a year ago, and 50% say harder (AGC 2026 Workforce Survey, Sep 2026).
- Roughly three-quarters of firms with openings for cement masons report trouble filling them (AGC Workforce Survey Analysis, Sep 2026).
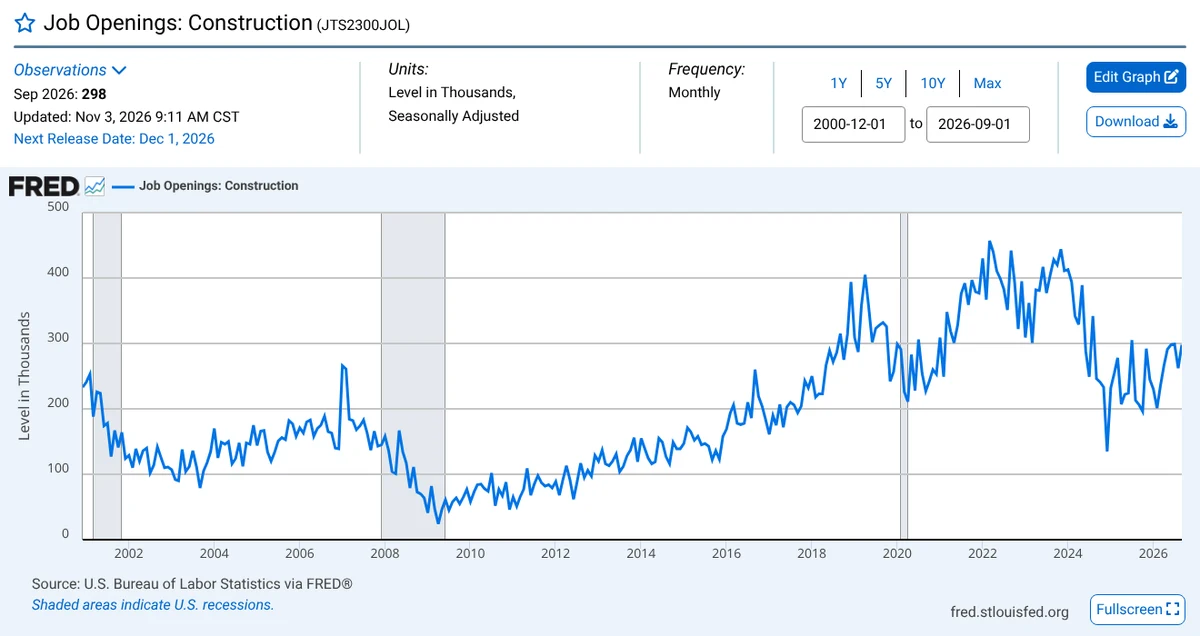
- Construction had 298,000 job openings in September 2026, up from 206,000 a year earlier (BLS JOLTS via FRED, Sep 2026).
Why are concrete jobs going unfilled?
Contractors say applicants lack the skills, and the ones they hire often don't stay.
- 50% of firms say available candidates lack the skills, certificates or licenses the work requires, down from 57% in 2025 (AGC Workforce Survey Analysis, Sep 2026).
- 42% say new hires fail to show up or quit soon after starting (AGC Workforce Survey Analysis, Sep 2026).
- 83% report at least some turnover among new field employees in their first 90 days (AGC Workforce Survey Analysis, Sep 2026).
- 42% of firms say worker shortages have delayed their projects (AGC 2026 Workforce Survey, Sep 2026).
What are contractors paying?
More each year.
- Production and nonsupervisory construction workers averaged $39.70 an hour in October 2026, up from $37.74 a year earlier (BLS Current Employment Statistics via FRED, Oct 2026).
- 55% of firms raised base pay for hourly trade workers by more than they had the year before (AGC Workforce Survey Analysis, Sep 2026).
- 73% of firms expect to add employees over the next 12 months (AGC Workforce Survey Analysis, Sep 2026).
- U.S. construction employment was 8.37 million in October 2026 (BLS Current Employment Statistics via FRED, Oct 2026).
- Specialty trade contractors, the group that includes concrete crews, employed 5.28 million (BLS Current Employment Statistics via FRED, Oct 2026).
How dangerous is construction work?
Dangerous enough that falls alone kill hundreds of workers a year.
- 5,070 U.S. workers died from job injuries in 2024, down 4.0% from 2023 (BLS Census of Fatal Occupational Injuries, Feb 2026).
- The fatal injury rate across all jobs was 3.3 per 100,000 full-time workers (BLS Census of Fatal Occupational Injuries, Feb 2026).
- Falls, slips and trips killed 844 workers across all occupations (BLS Census of Fatal Occupational Injuries, Feb 2026).
What is being built in Kansas and Douglas County?
Kansas is building more housing than it has in years. Around Lawrence, most of the new single-family houses are going up outside the city limits.
How many homes is Kansas permitting?
About 10,000 units a year, against a national total that is falling.
- Nationally, permit offices authorized 1,431,616 housing units in 2025, 3.1% fewer than in 2024 (U.S. Census Bureau Building Permits Survey, May 2026).
- Kansas issued permits for 653 single-family homes in September 2026 (U.S. Census Bureau via FRED, Sep 2026).
- Kansas construction employment was 77,900 in September 2026, up from 73,600 a year earlier (BLS State Employment via FRED, Sep 2026).
What is getting built around Lawrence?
Rural lots and the smaller towns are carrying the single-family market.
- Unincorporated Douglas County permitted 71 single-family homes in 2025, with a combined construction value of $36.4 million (U.S. Census Bureau Building Permits Survey place file, May 2026).
- Baldwin City permitted 21 single-family homes, valued at $8.5 million (U.S. Census Bureau Building Permits Survey place file, May 2026).
- Eudora permitted 12 single-family homes and 96 apartments in buildings of five or more units (U.S. Census Bureau Building Permits Survey place file, May 2026).
How much cement moves through Kansas?
Kansas makes more cement than it uses and ships the rest out.
- Cement plants in the Kansas district shipped 2.55 million metric tons of portland and blended cement in 2025, up from 2.46 million in 2024 (USGS Mineral Industry Surveys, Apr 2026).
- Kansas job sites and ready-mix plants received 1.05 million metric tons of blended cement in 2025 (USGS Mineral Industry Surveys, Apr 2026).
- They received another 356,000 metric tons of straight portland cement (USGS Mineral Industry Surveys, Apr 2026).
How many miles of road does Kansas maintain?
About 139,000, and counties own most of them.
- Kansas has 138,993 miles of public road (FHWA Highway Statistics, Oct 2025).
- County governments own 109,218 miles of the state's rural roads (FHWA Highway Statistics, Oct 2025).
- The Kansas Department of Transportation owns 10,296 miles (FHWA Highway Statistics, Oct 2025).
Are Kansas contractors short of workers too?
Yes, based on a small sample of 30 Kansas firms.
- 86% of Kansas contractors surveyed have openings for hourly trade workers (AGC Kansas Workforce Survey Results, Sep 2026).
- 48% say those jobs are harder to fill than a year ago (AGC Kansas Workforce Survey Results, Sep 2026).
- 45% say new hires fail to show up or quit shortly after starting (AGC Kansas Workforce Survey Results, Sep 2026).
How much carbon comes from cement?
Making cement releases CO2 twice, once from the fuel and once from the limestone itself. The industry's main answer so far has been to put less clinker in each bag.
How much do cement plants emit?
More than half of everything the minerals sector reports.
- The minerals sector as a whole reported 109.4 million metric tons of CO2-equivalent for 2023, from 385 facilities (EPA Greenhouse Gas Reporting Program, Aug 2024).
- Lime manufacturing, the next-largest source in the sector, reported 25.6 million metric tons (EPA Greenhouse Gas Reporting Program, Aug 2024).
What is the cement industry doing about it?
Switching to blended cement, mostly portland-limestone.
- Blended cement made up 63% of U.S. cement shipments in the first nine months of 2025 (USGS Mineral Commodity Summaries, Feb 2026).
- Portland-limestone cement shipments reached 62.7 million metric tons in 2025, 96% of all blended cement (USGS Mineral Industry Surveys, Apr 2026).
- Portland-limestone cement cuts emissions by up to 10% compared with ordinary portland cement (American Cement Association, May 2025).
- Switching to lower-carbon cement has avoided more than 10.5 million metric tons of carbon emissions since 2021 (American Cement Association, May 2025).
- All 50 state transportation departments now accept portland-limestone cement (American Cement Association, May 2025).
- Alternative fuels supply 16% of the cement industry's energy (American Cement Association, May 2025).
- Six carbon capture projects are planned or underway at U.S. cement plants, with total investment of $35 billion (American Cement Association, May 2025).
Methodology and Sources
Every figure on this page comes from the agency, trade association or research group that produced it: the U.S. Geological Survey, the Bureau of Labor Statistics, the Census Bureau, NOAA, EPA, the Federal Highway Administration, the Kansas Department of Transportation, the National Association of Home Builders, the Associated General Contractors of America and the American Cement Association. We did not cite statistics roundups. BLS and Census series pulled from FRED, the St. Louis Fed's data service, are credited to the agency that collects them and dated by the month of the data. Percentage changes in price indexes since January 2020 are our own arithmetic on the published index values. The Kansas AGC results come from 30 firms and should be read as a rough signal. The KDOT pavement study dates to 2014 and remains the state's most complete field survey of freeze-thaw damage. We check for new releases each month and update the count in the title when figures change.
Glossary
- Aggregate: the sand, gravel and crushed stone that make up most of a concrete mix.
- AGC: Associated General Contractors of America.
- Blended cement: cement that replaces part of its clinker with limestone, slag or fly ash.
- BLS: U.S. Bureau of Labor Statistics.
- Clinker: the kiln-fired nodules that are ground to make cement.
- CO2e: carbon dioxide equivalent, a common unit for different greenhouse gases.
- D-cracking: cracking along pavement joints caused by aggregate that breaks down under repeated freezing and thawing.
- FRED: Federal Reserve Economic Data, the St. Louis Fed's database of public statistics.
- KDOT: Kansas Department of Transportation.
- NAHB: National Association of Home Builders.
- PLC: portland-limestone cement, also sold as Type IL.
- PPI: producer price index, which tracks what manufacturers receive for their goods.
- USGS: U.S. Geological Survey.
- West North Central division: the Census Bureau's grouping of Kansas, Missouri, Nebraska, Iowa, Minnesota and the Dakotas.
Sources
- USGS, Mineral Commodity Summaries 2026: Cement
- USGS, Mineral Commodity Summaries 2026: Sand and Gravel (Construction)
- USGS, Mineral Commodity Summaries 2026: Stone (Crushed)
- USGS, Mineral Industry Surveys: Cement in December 2025
- BLS, Producer Price Index: Ready-Mix Concrete Manufacturing, via FRED
- BLS, Producer Price Index: Ready-Mix Concrete, Midwest Census Region, via FRED
- BLS, Producer Price Index: Cement Manufacturing, via FRED
- BLS, Producer Price Index: Concrete Block and Brick Manufacturing, via FRED
- BLS, Producer Price Index: Other Concrete Product Manufacturing, via FRED
- BLS, Job Openings: Construction, via FRED
- BLS, Average Hourly Earnings of Production and Nonsupervisory Employees, Construction, via FRED
- BLS, All Employees, Construction, via FRED
- BLS, All Employees, Specialty Trade Contractors, via FRED
- BLS, All Employees: Construction in Kansas, via FRED
- BLS, National Census of Fatal Occupational Injuries in 2024
- U.S. Census Bureau, Monthly Construction Spending, September 2026
- U.S. Census Bureau, 2025 Annual Building Permits
- U.S. Census Bureau, Building Permits Survey, Midwest place file 2025
- U.S. Census Bureau, Monthly New Residential Construction, September 2026
- U.S. Census Bureau, 1-Unit Building Permits for Kansas, via FRED
- NAHB, Share of New Homes with Patios Dips to a Six-Year Low
- NAHB, Slabs Overtake Basements in the East North Central Division
- NAHB, Share of New Homes with Decks Inches Upward
- NAHB, Where Are Porches Most Common for Newly-Built Homes?
- NAHB, Parking Trends in Newly Completed Single-Family Homes, 2024
- NAHB, Cost of Constructing a Home in 2024
- Kansas Department of Transportation, Aggregate Freeze-Thaw Testing and D-Cracking Field Performance: 30 Years Later (KS-14-04)
- NOAA NCEI, 1991-2020 Annual and Seasonal Climate Normals, Lawrence, KS station data
- NOAA NCEI, U.S. Climate Normals Quick Access, Lawrence, KS
- AGC and NCCER, 2026 Workforce Survey news release
- AGC and NCCER, 2026 Workforce Survey Analysis
- AGC and NCCER, 2026 Workforce Survey Results: Kansas
- U.S. EPA, GHGRP Minerals Sector
- American Cement Association, How America's Cement Industry Is Cutting Emissions
- FHWA, Highway Statistics 2024, Table HM-10
- FHWA, Highway Statistics 2024, Table HM-80